
Pull up your blended CAC by quarter for the last two years. For the first stretch it probably held flat or drifted down as the creative got sharper and the pixel learned. Then one quarter it ticked up. Then another. Now the line has a shape to it, and your CFO has started asking about payback period in meetings that used to be about revenue.
That curve is the most predictable thing in direct to consumer marketing, and it is not a sign that anyone is doing their job badly. That’s just what happens when a brand scales inside an auction.
The next customer costs more because the cheap ones already bought, and every rival in your category is bidding for whoever is left.
There is a specific number on that curve where the math stops working. Plenty of teams find it two quarters late, after the budget is already committed. But there’s one customer story of ours that illustrates what it looks like when planning comes first.
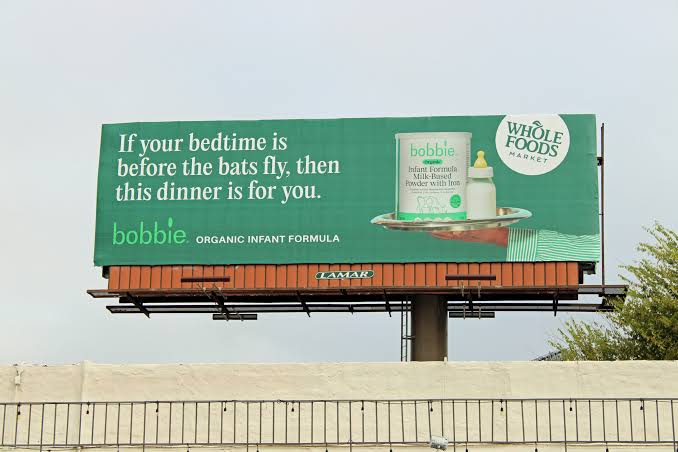
Bobbie cut CPM 45% and lifted checkouts 486% with one billboard
Bobbie, the organic infant formula brand, wanted to grow in Austin around its Whole Foods partnership. The plan that ran was one static bulletin, and the efficiency numbers are the part worth copying.
- Planning started with zip codes, not placements. Index scoring identified high-performing Austin zip codes, then a geofence around flagship Whole Foods stores surfaced the home zip codes of frequent shoppers inside a target of women and families aged 18 to 35 with household income above $80,000.
- One bulletin replaced a multi-city plan. The single high-visibility placement near the flagship store carried creative that named product availability at Whole Foods.
- Campaign CPM fell 45%, helped by 38% more impressions than the delivery plan called for and roughly three weeks of bonus visibility after the scheduled end date. That over-delivery is structurally impossible in an auction, where unsold inventory is not given away, it is sold to the next bidder.
- Checkout completions lifted 486% against an unexposed control group, with homepage visits up 19% and Starter Bundle page visits up 79%, measured through mobile ad ID and web pixel matching. Full detail is in the Austin billboard case study.
- The launch campaign repeated the pattern at scale. Across five weeks, Bobbie’s national launch delivered 139.7 million impressions against a plan of 38.6 million, and campaign CPM dropped 72%, from $2.65 to $0.69.
HexClad’s multi-market campaign followed the same planning logic in a different category. Neither brand moved an annual budget to find out whether it worked.
Why direct to consumer marketing costs more with every customer you add
Meta and Google sell you the easiest buyers first. Their delivery systems are built to spend your money on whoever looks most likely to convert, so your early spend lands on the people who were already close to buying. Scaling means asking the same system to find people who look less like that. As Recast puts it, the highest-intent audience converts in the first runs, and expansion means reaching audiences who are either less relevant or more expensive to reach.
Every increment of budget buys a worse version of the previous increment:
- The next audience segment is further from your core buyer, so conversion rate drops while impression cost holds
- Frequency climbs against the audience you have already reached, which fatigues creative faster than you can replace it
- Your competitors are scaling into the same segments on the same platform, which raises the clearing price for all of you
- Seasonal spend from brands outside your category still bids against you, so your Q4 CPM rises for reasons that have nothing to do with your product
None of that is fixable from inside the account. This is the central constraint on direct to consumer marketing at scale, and it is why a DTC brand can run better creative than it did last year and still post a worse CAC.
The question is when the curve crosses the line that matters to your P&L.
Which CAC number tells you paid social has stopped working?
Blended CAC is the number on the board deck, and it is the last number to tell you anything is wrong. It averages the cheap customers you bought eighteen months ago into the same figure as the expensive ones you bought last week. Marginal CAC, the cost of the customers your most recent budget increase actually produced, moves first and moves hard.
| Metric | What it measures | What it hides |
|---|---|---|
| Blended CAC | Total acquisition spend divided by all new customers in the period | The rising cost of your newest customers, averaged away by cheaper historical ones |
| Marginal CAC | Incremental spend divided by the incremental customers that spend produced | Nothing on cost, though it needs a deliberate budget step to measure cleanly |
| First-order contribution margin | Gross profit on a single first order, after COGS, shipping, and payment fees | The customers who would eventually repay a higher CAC through repeat purchase |
Sources: Common Thread Collective’s work on modeling marginal spend against efficiency.
Illustrative example, (not client data): monthly Meta spend goes from $150,000 to $180,000 and new customers go from 3,000 to 3,400.
Blended CAC reads $53. Marginal CAC on that last $30,000 is $75. If first-order contribution margin is $60, the growth you just bought lost money while the dashboard stayed green.
That gap is the number the brief in your head has been looking for.
When marginal CAC passes first-order contribution margin, the next dollar of paid social spend is a loan against lifetime value you have not collected yet. Customer acquisition cost stops being a marketing metric at that point and becomes a cash flow question.
Teams who spot it usually reach for three responses first.
3 standard fixes that buy time and leave the auction untouched
Each of these is worth doing. None of them changes the price of reaching a new person on a platform where your competitors set the price with you.
1. Faster creative testing resets fatigue for a few weeks, then the same ceiling returns
Shipping ten new concepts a week instead of two genuinely improves performance, because fresh creative lifts click-through and pushes the saturation point further out. The limit shows up quickly:
- The audience is the same size after the refresh as it was before
- Production cost rises with volume, and it belongs inside your CAC calculation
- The gain decays on a schedule, so the team runs the same sprint again next month
Better creative buys you a higher ceiling in the same room. It does not add a room.
2. Retention raises what you can afford to pay without changing what you pay
Email, SMS, and subscription offers lift lifetime value, which raises the CAC your model can justify.
That is real economics and it should be the first thing any DTC brand fixes. It also has a timing problem in that retention gains show up over quarters, while the auction reprices weekly. A higher allowable CAC invites more spend into the same rising curve but the math only works if repeat rate actually holds at the new acquisition volume
Retention widens your tolerance for a bad number. The number keeps climbing.
3. A second paid channel moves budget into another auction with the same competitors
Adding TikTok or expanding Google Shopping does open new inventory, and the first weeks often look good.
Then the structural issue returns, because you are still buying attention priced by real-time competition from brands who want the same buyer. New auction, same mechanism, and usually a shallower audience pool than the one you left.
What changes the equation is buying reach that nobody else can outbid you for mid-flight.
How a channel with no auction changes direct to consumer marketing math
A directly bought billboard, transit placement, or wallscape is a fixed rate for a fixed flight. You agree a price, you hold the space for the period, and a competitor with a larger budget cannot reprice your placement halfway through the run.
Supply is finite and physical rather than infinitely divisible and re-auctioned every millisecond, which inverts the dynamic that makes paid social expensive at scale.
That structure shows up in the cost of reach. Analysis from Solomon Partners, published through the OAAA, found OOH delivers audience reach at a lower CPM than television, radio, print, and most digital formats. The relevant comparison for a D2C brand is not brand recall, which is where the trust argument for billboards usually starts. It is what a thousand impressions costs when the price was set before your competitor’s Q4 budget landed.
Two qualifications matter. Programmatic digital OOH does run on real-time bidding, so it carries some of the same pressure as the channels you are trying to escape. And OOH inventory is physically finite, which means the good placements are gone months ahead of when you want them. The same finiteness that protects your rate also punishes late planning.
This is why growth-stage brands buying billboards tend to be the ones whose paid CAC got uncomfortable first. The clearest version of that math comes from a single board in Austin.
How to test OOH in one market before moving annual budget
A first test should cost less than a month of the paid social spend that is currently producing your worst marginal CAC. Four steps.
- Pick the market from your own customer data. Rank your existing customers by zip code, find where density is high and your brand awareness is not, and start there. This is the step that separates a test from a guess, and it is the same input the Bobbie plan started with.
- Hold a comparable market out. Choose a second market with similar customer density and similar current spend, and leave it alone. Without a holdout you will spend the next quarter arguing about seasonality.
- Buy a fixed flight in a small number of high-index placements. Four to eight weeks is enough to read. Decide between static, digital, or mobile formats based on whether you need dwell time or coverage, and book early, because inventory in the strongest locations gets committed months ahead.
- Read blended new-customer CAC and branded search across both markets. Compare the test market against the holdout for the flight period and four weeks after. Expect a directional read at the market level rather than a per-campaign attribution number, and treat branded search volume and post-purchase survey responses as part of the signal.
If the test market’s blended new-customer CAC separates from the holdout while spend holds steady, you have found a channel that adds volume without bidding against yourself.
Find your marginal CAC before you scale again
The chart on your screen is not a performance problem. Your team is shipping more creative than it was a year ago and the cost per customer is still climbing, because the auction reprices faster than any account-level fix can keep up. The moment worth acting on is the one where the next customer costs more than the first order earns, and blended CAC will not tell you when that happens.
Onescreen plans OOH around who your customers actually are and where they actually go, mapping your buyer to real-world placements before any budget moves. For consumer brands working through a rising CAC curve, the first conversation is a market read, not a media plan. Let’s talk.